Problem Graph
Symptom vs Cause of a Problem: How to Tell Them Apart
A symptom comes back after you remove it; a cause does not. How to tell them apart, where the idea comes from, and where the hunt for one root cause goes wrong.
Problem Graph
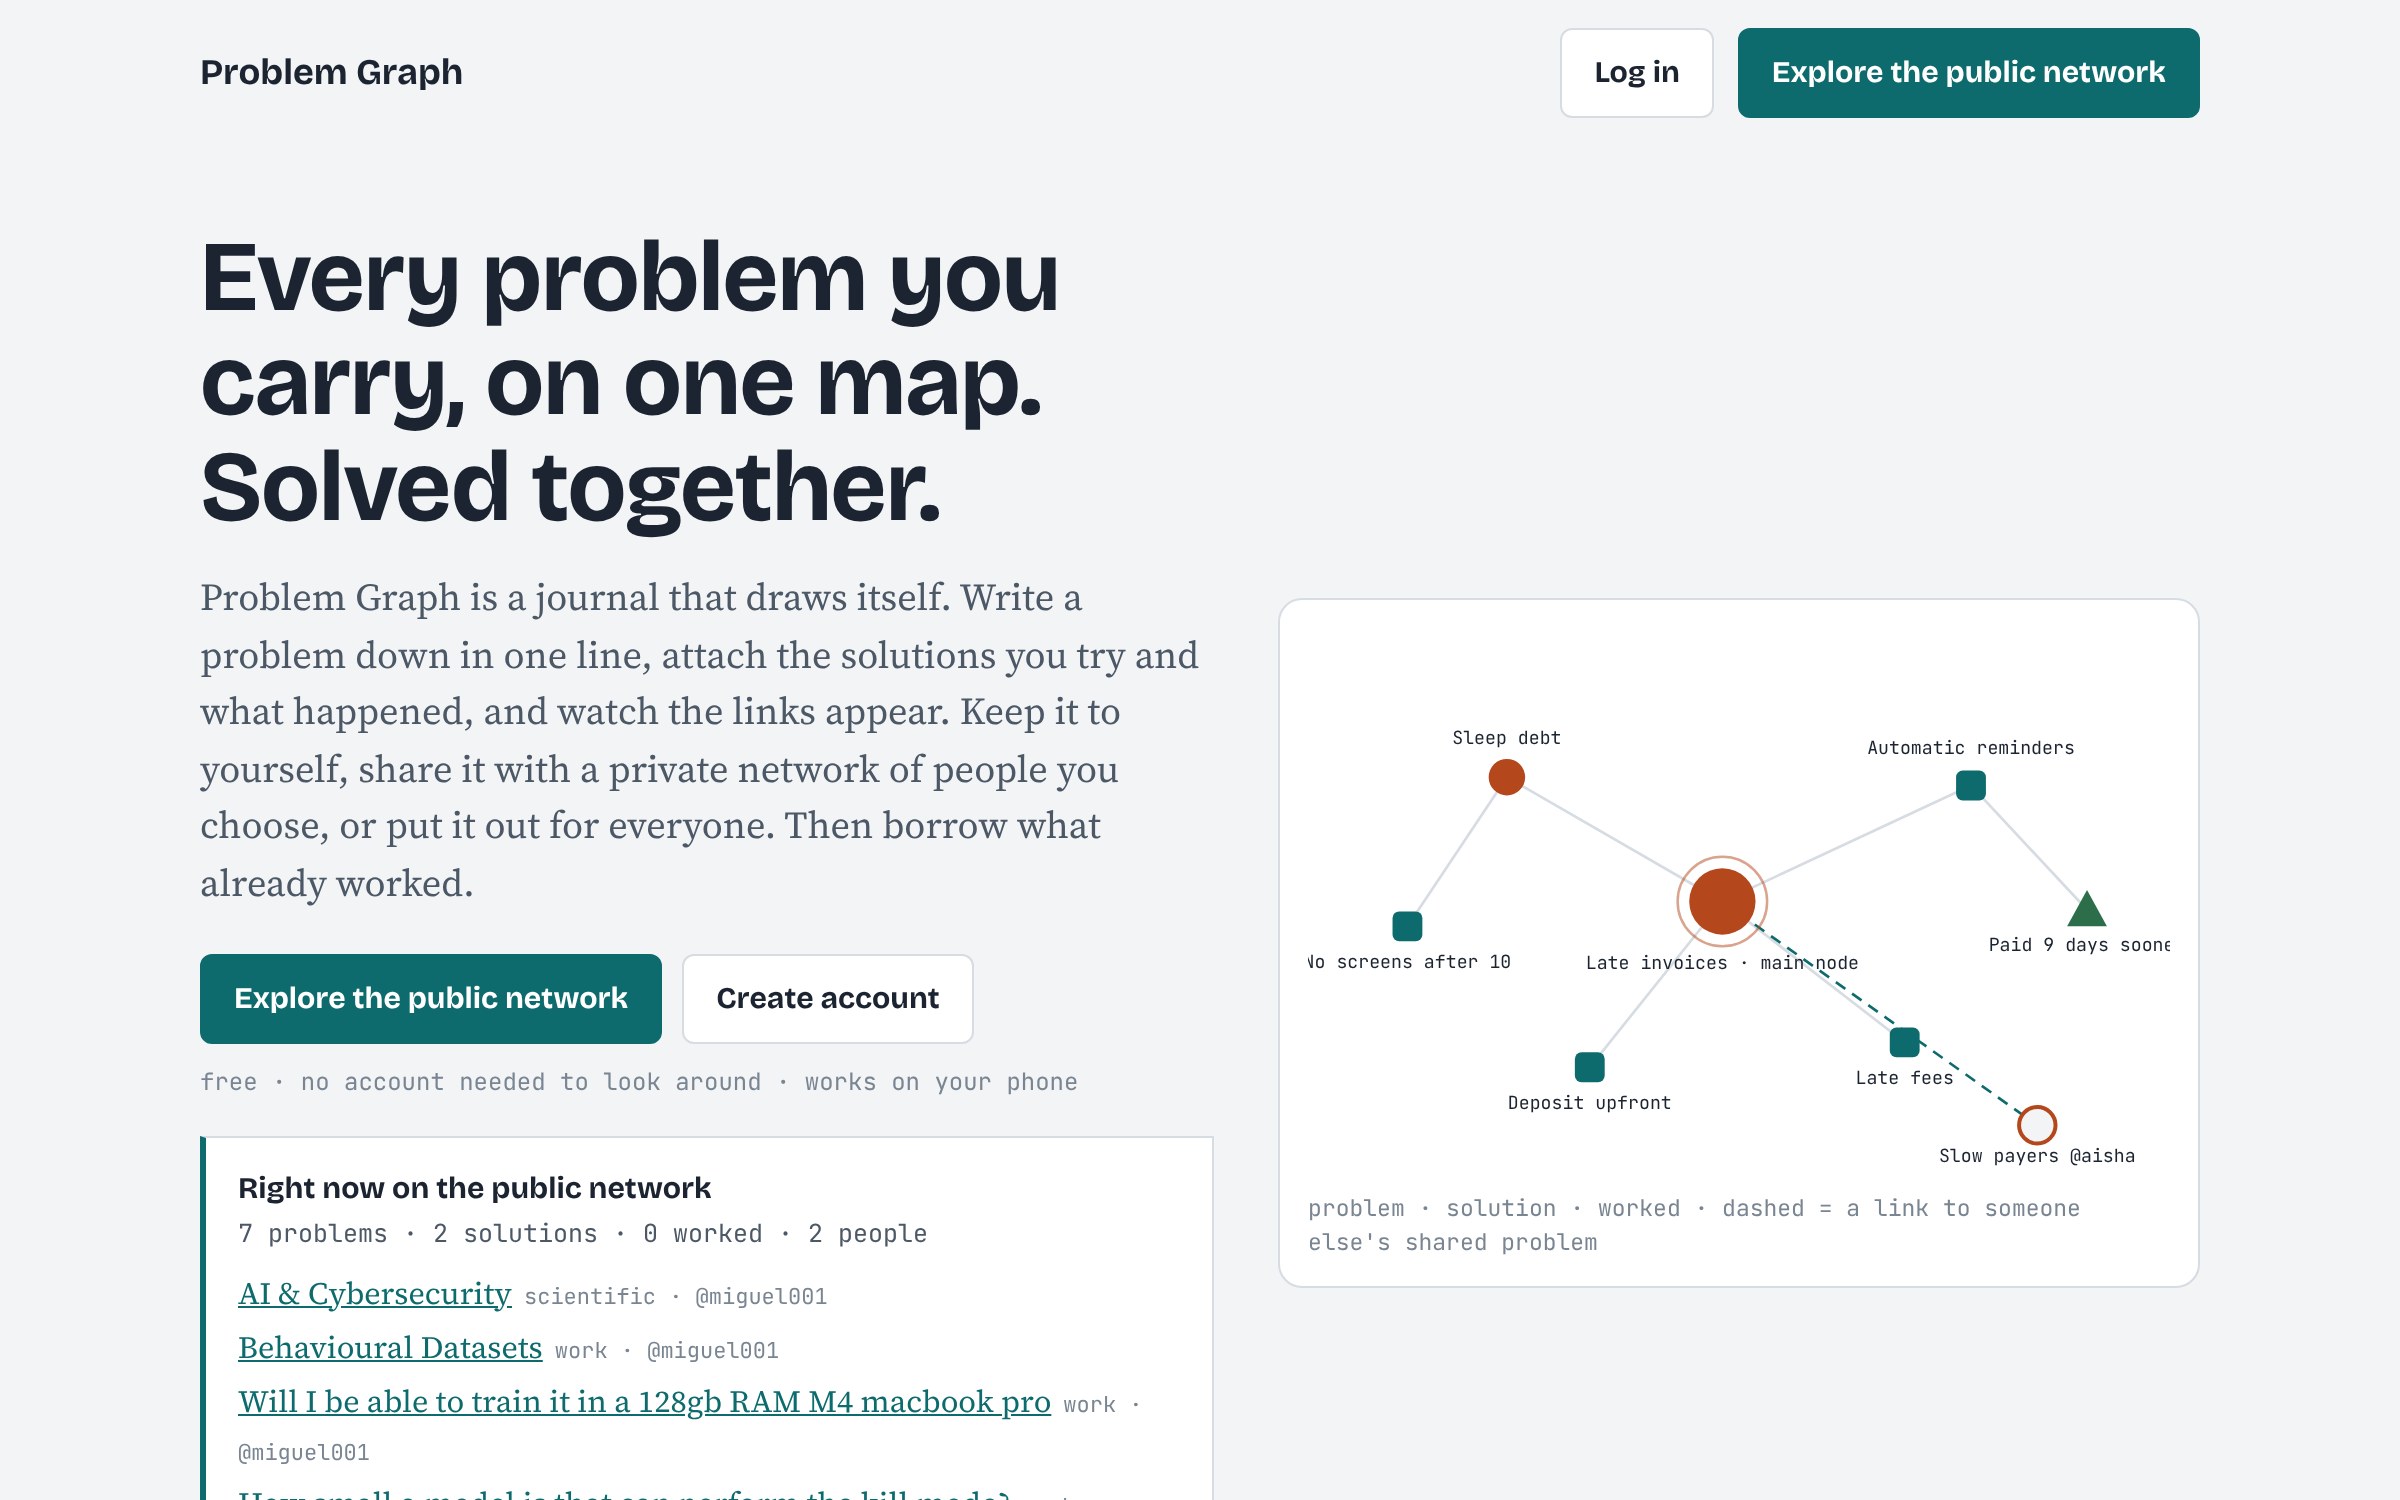
A journal of problems and the solutions tried on them, drawn as a graph that can stay private, go to people you choose or go public.
In the symptom vs cause question, a symptom is the thing you notice and a cause is a condition that produces it. Remove a symptom and it comes back; remove a cause and the symptom stops, so the only sure way to tell them apart is to change one thing, write down what happened, and see whether the trouble returns.
That rule needs a record to run on. Problem Graph is a journal of problems and the solutions tried on them, where each solution gets an outcome (worked, partly or failed) and a failed one stays on the map.
Symptom vs cause: the removal rule
Three checks follow from the definition, and each one needs something written down.
- Removal. Take the suspected cause away and leave everything else alone. If the trouble stops, you found a cause. If it carries on, you removed a symptom or a bystander.
- Recurrence. Count how many times you have applied the same fix. A fix you repeat every month is aimed at a symptom, because a cause that was removed does not need removing again.
- Company. Look for other problems that started at the same time or flare up together. Two troubles that rise and fall together often share one condition upstream of both.
None of these can be done from memory. Memory keeps the fix that felt decisive and drops the three that did nothing, and the three that did nothing are the evidence.
Where the hunt for a root cause comes from
The modern habit of digging under a symptom comes from a factory floor. The five whys technique was described by Taiichi Ohno at Toyota Motor Corporation: ask why the fault happened, then ask why of the answer, and keep going. The usual illustration starts with bolts cross-threading in an engine block. The threads were not cut cleanly. The cutting tool had not been changed. The bin of replacement tools was empty. Its contents had rolled under the shelves. One foot of the shelving had rusted through.
The same page traces the form much further back, to a 1671 letter in which Leibniz chained one why onto another. The page also records that people inside and outside Toyota have criticized the routine as too basic, and that five is a convention: the count can be higher or lower.
A symptom and a cause are positions in a chain
The distinction most people get wrong is treating "symptom" and "cause" as two kinds of thing. They are two positions. In the bolt chain, the empty bin is the cause of the unchanged tool and a symptom of the fallen shelf. Every link is both, depending on which way you look.
So the useful question is where to stop. The answer in the bolt case is instructive: the rusted foot is not the end, because a new foot can rust too. The chain ends at a missing routine, nobody inspects the shelving. Stop at the deepest link you can change and that would stay changed. Deeper than that you reach things like "metal rusts", which are true and useless.
Why the first cause you name feels right
The first explanation that comes to mind arrives with a feeling of understanding, and that feeling is poor evidence. In September 2002 L. Rozenblit and F. Keil of Yale University reported twelve studies on what they named the illusion of explanatory depth: people feel they understand complex phenomena with far greater precision and depth than they really do. The illusion was far stronger for explanations than for facts, procedures or stories.
That asymmetry matters here. You know the facts of your problem well: the dates, the amounts, who said what. Your account of why it happens is the part you are most likely to overrate. Writing the suspected cause down as a claim that a specific change could prove wrong turns the feeling into something you can check.
What 302 investigations ended up fixing
Hospitals run formal cause-hunting after serious harm, which makes them a well-documented case of how it goes in practice. A team led by K. M. Kellogg examined 302 root cause analyses carried out over eight years at one large academic medical institution. Solutions were proposed in 106 of them, 731 solutions in all. The most common were training (20%), process change (19.6%) and reinforcing an existing policy (15.2%).
The authors call these weaker actions, less likely to stop the event happening again, and they report that several types of event were repeated during the study period despite repeated analyses. Read with the removal rule, that is what a symptom fix looks like from the outside: the investigation ends, a reminder goes out, and the same event returns.
The strongest objection: there may be no single cause
The sharpest criticism is aimed at the phrase itself. In May 2017 M. F. Peerally and three colleagues argued that the first problem with root cause analysis is its name. Implying one root promotes what they call a flawed reductionist view, and it produces a simple straight-line story in place of several contributions acting on each other.
They add two pressures that push toward the wrong stopping point. Investigations run to deadlines (60 days in the United Kingdom, 45 in the United States), and a team may stop at "a cause of mutual convenience", one that leaves out anything beyond its power to change. Their example is a hospital where two lenses ended up in one operating room. The action plan was a new protocol, a training programme, better documentation and a poster. They also note that estimates of how many such plans are carried out at all range from 45% to 70%.
The objection does not cancel the removal rule. It changes what you expect from it: several partial causes, each of which removes part of the trouble.
A worked example: late invoices with two causes
Take a freelance designer who runs short of cash at the end of most months. Covering the gap from savings is the fix that gets repeated, which the recurrence check marks as a symptom fix. One why back: of the last 12 invoices, 7 were settled after the due date, on average 16 days late.
The suspected cause is that clients forget. Written as a claim: if automatic reminders go out, fewer than 7 of the next 12 invoices will be late. The reminders go on and nothing else changes. Of the next 12 invoices, 3 are late.
That outcome is "partly", and the detail matters more than the label. All 3 late invoices belong to one client, and the reminders did nothing to them. So forgetting was a cause for most clients and not for this one. A second why, asked of that client alone, finds an approval round that takes six weeks whatever the due date says. No reminder can reach that. A deposit upfront can, and it is the next thing to try.
The consequence is two causes with two different fixes. Someone who stopped at "clients forget" would have kept sending reminders to the one client they could never work on, and someone who trusted memory would have recalled only that reminders "helped".
Frequently asked questions
Can a problem have more than one cause?
Yes, and the research on formal investigations treats that as the normal case. Expect a fix to remove part of the trouble, and treat what remains as a pointer to the next cause.
How many times should you ask why?
Five is a convention from Toyota, and the count can be higher or lower. Stop at the deepest link you are able to change and that would stay changed.
Is a symptom ever worth treating?
Yes, when it is doing damage now and the cause will take time to find. Record it as a symptom fix so that its repetition is counted and not mistaken for a solution.
What if removing the suspected cause changes nothing?
Then it was not a cause, and that result is worth keeping. A recorded failure rules out one branch of the chain and stops the same idea being tried again a year later.
What telling a symptom from a cause leaves unsettled
Two things are still open. The first is evidence. Peerally and colleagues note that few studies have looked at whether the fixes that come out of cause investigations work, and they offer ranking fixes by strength only as a possibility to be evaluated. The hospital data show weak fixes and repeated events side by side; they do not show how much better strong fixes do.
The second is scale. One incident studied alone hides what a set of incidents reveals, and the same authors point to a redesigned product as the kind of fix that appears only when many cases are laid next to each other. For a single person that means one problem may be the wrong unit. The cause of a symptom in one part of a life can sit in another part, and it shows only when both are written down where they can be compared.
Problem Graph
Every problem you carry, on one map. Solved together. Visit problemgraph.vlvd.net